
A flame graph is a graphical representation that helps to quickly understand where a program spends most of its processing time. These graphs are based on sampled information collected by a profiler while the observed software is running. At regular intervals, the profiler captures and stores the current call stack. A flame graph is then generated from this data to provide a visual representation of the functions in which the software spends most of its processing time. This is useful for understanding the characteristics of a program and for improving its performance.
This blog post explores the fundamentals of flame graphs and offers a few practical tips on utilizing them to identify and debug performance bottlenecks in PostgreSQL.
The content presented in this blog post is based on material found in other articles or blog posts, as well as in Brendan Gregg’s excellent book on system performance. Over the years, I have collected a number of commands in my lab notebook that I typically use when diagnosing PostgreSQL-related performance problems. I have shared these commands in several emails over the years, so I decided to write a whole blog post on this topic.
Flame Graphs
Flame graphs are based on data captured by a profiler. They aggregate call stacks to make it easier to see where a program spends most of its processing time. Without aggregation, it is difficult to see the big picture in the thousands (or more) of call stacks that a profiler collects.
When a flame graph is created, these call stacks are collapsed, and the time spent in similar call stacks is summed up. Based on this data, the flame graph is created. The idea behind this is as follows: the more time a program spends in a particular code path, the more often those call stacks will appear in the samples. Since the resulting graph consists of call stacks of different heights, and the stacks are usually colored in red to yellow tones, it looks like a flame.
Brendan Gregg states in ‘The Flame Graph’, ACM Queue, Vol 14, No 2:
A flame graph visualizes a collection of stack traces (aka call stacks), shown as an adjacency diagram with an inverted icicle layout.7 Flame graphs are commonly used to visualize CPU profiler output, where stack traces are collected using sampling.
An example flame graph looks like this:
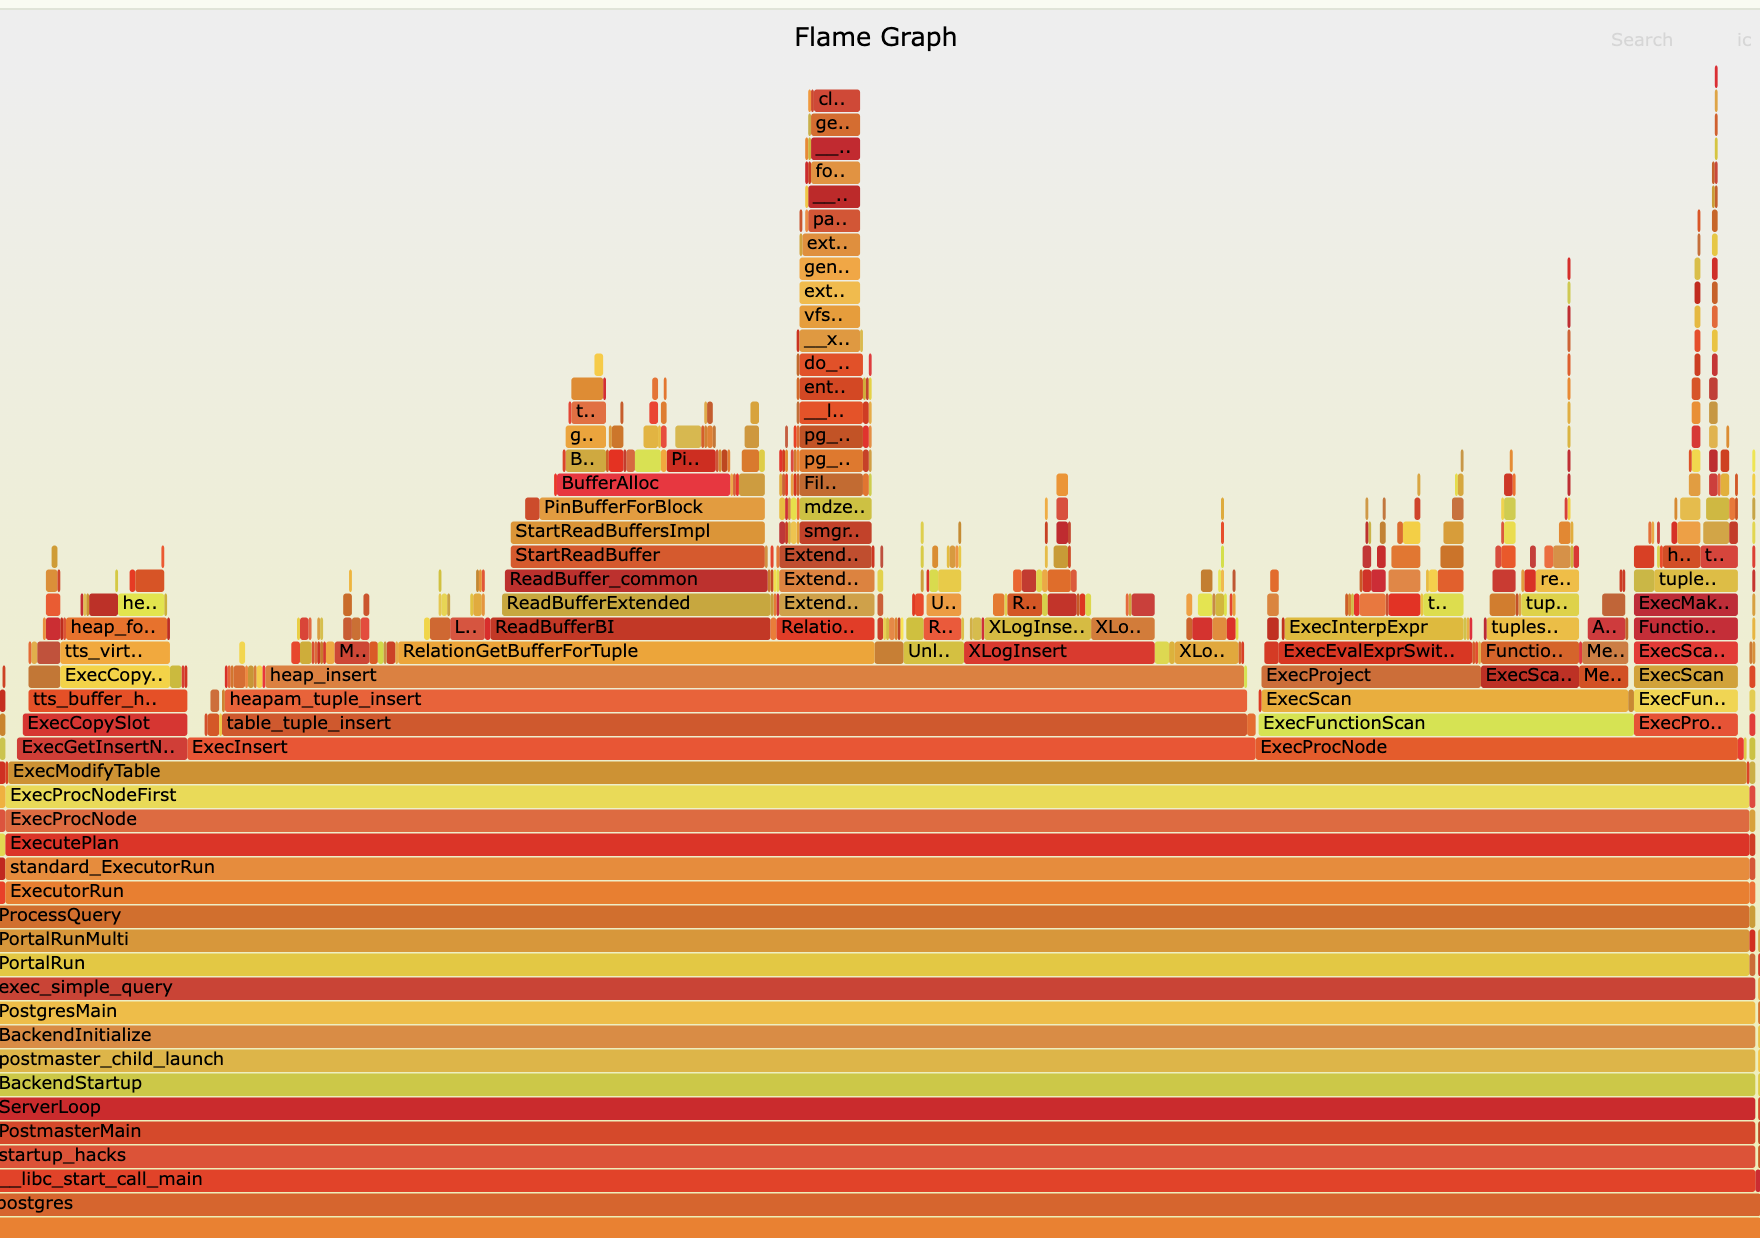
In this flame graph, it can be seen that most time is spent in the ExecModifyTable function, which is part of the PostgreSQL executor. This function calls other functions like ExecInsert or ExecProcNode. ExecInsert is the one which takes the most time. So, when performing a performance analysis (and searching for functions that are worth optimizing), it is important to focus on the functions with a long bar on the x-axis. The longer the bar, the more time is spent in that function.
Creating a Flame Graph
As I primarily work on diagnosing performance issues in PostgreSQL, this blog post will focus on creating flame graphs for PostgreSQL. However, the presented methods can also be used to generate flame graphs for other applications written in C or Rust.
To profile a PostgreSQL backend process, the PID (Process ID) of the process needs to be known. To get the PID of the PostgreSQL backend process, you can use the following command:
mydb=# select pg_backend_pid();
 pg_backend_pid
----------------
        2112031
(1 row)
In this example, the PID is 2112031. Now, the data for the flame graph can be collected. Two ways to collect and process the data are available: using the perf tool or using the FlameGraph tool by Brendan Gregg. The first method is more straightforward since only one command is needed to collect and process the data. However, the second method is more flexible and allows for more advanced processing of the collected data. So, let’s start with the first FlameGraph method first.
Processing the Collected Data using FlameGraph
The FlameGraph tool can be found in the FlameGraph repository. To use it, you need to clone the repository:
git clone https://github.com/brendangregg/FlameGraph
This needs to be done only once. Afterward, the perf tool can be used to collect the data for the flame graph. Perf is a powerful profiler available for Linux systems.
The following command captures the call stacks of the PostgreSQL backend process with PID 2112031:
sudo perf record -a -g -F 111 -o data.perf -p 2112031
The parameter -a means that all CPUs are monitored, -g enables call graph recording, -F 111 sets the sampling frequency to 111 Hz, and -o data.perf specifies the output file. The frequency should be adjusted based on the monitored process (shorter workloads may require a higher frequency). In addition, the frequency should be set to a value that is not used by any cyclic task (e.g., a job that is executed every 100 ms) in the system. Otherwise, the profile will always or never run at the moment the cyclic task is executed. So, the value 111 Hz is a good choice, as it is not a common value for cyclic tasks.
Now, the workload that you want to profile should be executed. For example, the following query can be executed a few times to let the PostgreSQL backend process do some work:
INSERT INTO data (key, value) SELECT i, i::text FROM generate_series(1, 100000) i;
The \watch command of the psql client can be used to execute the query repeatedly to allow the backend process to do some work. After some time (usually when the workload that should be profiled is complete), the perf tool can be terminated using CTRL+C and used to process the collected data. The following command generates a text file with the call stacks:
perf script -i data.perf > data.stacks
This command reads the data from the data.perf file and writes the call stacks to the data.stacks file, which can then be used to generate a flame graph. However, before the flame graph can be generated, the data.stacks file needs to be processed and folded:
~/FlameGraph/stackcollapse-perf.pl data.stacks > data.folded
Folding means that the call stacks are aggregated so that the time spent in similar call stacks is summed up. Based on this data, the flame graph can be created:
~/FlameGraph/flamegraph.pl data.folded > data.svg
The resulting SVG can be found here for reference.
Processing the Data with ‘perf script’
perf script flamegraph -a -F 111 -p 2112031 sleep 60
This command unifies all the manual commands we have used so far. It collects the call stacks of the PostgreSQL backend process with PID 2112031 for 60 seconds, and then generates a flame graph afterward.
Unfortunately, this method does not work out-of-the-box on Debian based distributions.
Flame Graph template /usr/share/d3-flame-graph/d3-flamegraph-base.html does not exist. Please install the js-d3-flame-graph (RPM) or libjs-d3-flame-graph (deb) package, specify an existing flame graph template (--template PATH) or another output format (--format FORMAT).
The reason for the error is that the required template file is not available on Debian-based systems. This is a known issue and has been reported in the Debian bug tracker. Until the bug is fixed and the package is created for Debian, you can use the package from the Fedora repository. To download the package and convert it to a Debian package, use the following commands:
wget https://rpmfind.net/linux/fedora/linux/development/rawhide/Everything/x86_64/os/Packages/j/js-d3-flame-graph-4.0.7-10.fc42.noarch.rpm
apt-get install alien
fakeroot alien js-d3-flame-graph-4.0.7-10.fc42.noarch.rpm
sudo dpkg -i js-d3-flame-graph_4.0.7-11_all.deb
Afterwards, the perf script command can be used to generate a flame graph. Although the flame graph can be generated using the perf script command, I prefer to use the FlameGraph tool directly, as it also allows you to generate differential flame graphs (see below).
The resulting HTML page can be found here for reference.
Build Types
When profiling, it is important to decide which build type should be used. A highly optimized build is typically used in production and can also be profiled. However, many functions are inlined in such builds, which can lead to misleading results in the flame graph. For example, if a function is inlined, it will not appear in the flame graph, even if it consumes a significant amount of time. Alternatively, a debug build can be used for profiling. However, a debug build is not optimized and may exhibit different performance characteristics than a production build. Additionally, some functions might only be executed in a debug build (e.g., assertions), which can also lead to misleading results in the flame graph. Therefore, it is essential to be aware of the build type used for profiling and to interpret the results accordingly.
For some hard-to-catch performance problems, I have created profiles for both build types (optimized and debug) and compared the results.
When compiling a debug version of PostgreSQL, I use the following options:
CFLAGS="-ggdb -O0 -g3 -fno-omit-frame-pointer"
Different Types of Flame Graphs
Several types of flame graphs exist. In addition to the standard flame graph, the most common are off-CPU flame graphs and differential flame graphs. These will be discussed in the following sections.
On-CPU / Off-CPU Flame Graphs
Usually, the flame graphs show the time spent in the code while the CPU is executing it. However, sometimes it is also useful to see how much time a process spends waiting for resources (e.g., I/O operations). In this case, off-CPU flame graphs can be used. The profiler also adds the time to the call stacks when the process is not running on the CPU.
An off-CPU flame graph can be taken by using the offcputime binary. For example:
sudo offcputime-bpfcc -df -p 12345 > out.stacks
The parameter -d means that these should be a delimiter between kernel/user stacks, -f produces the needed folded format. 12345 must be replaced with the process ID of the process to be observed.
Afterward, the output can be processed as follows:
~/FlameGraph/flamegraph.pl --color=io --title="Off-CPU Time Flame Graph" --countname=us < out.stacks > out.svg
Differential Flame Graphs
Differential flame graphs are used to compare two different profiler runs. Usually, the first run is a baseline run, which is used to compare the second run (e.g., after a potential performance improvement).
Using a differential flame graph makes the differences between the runs more obvious. Otherwise, the width of the bars has to be compared, which is a hard task. To create a differential flame graph, the .folded files of the two runs need to be created first. Afterward, the script difffolded.pl from the FlameGraph tool can be used to create a differential flame graph:
~/FlameGraph/difffolded.pl data.folded data2.folded | ~/FlameGraph/flamegraph.pl > diff.svg
The resulting SVG file will clearly highlight the differences between the two profiler runs. For example:
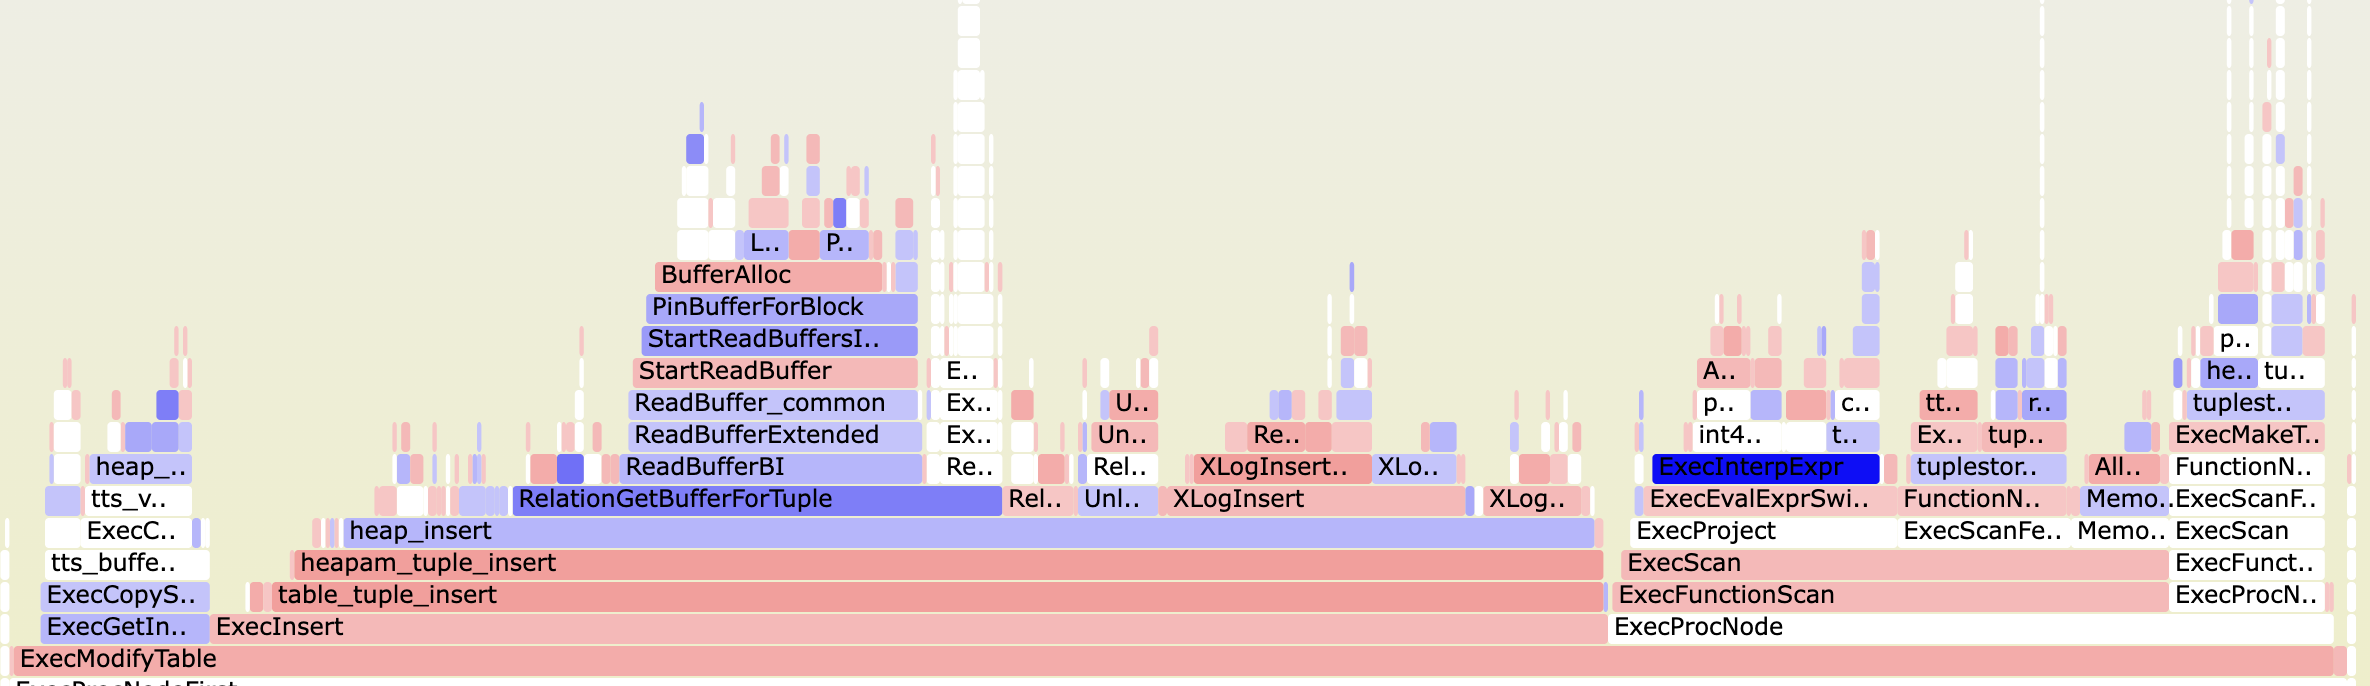
Functions marked in red are slower in the second run, while functions marked in blue are faster.
Conclusion
This blog post provides an overview of how to create flame graphs for PostgreSQL (and other applications) using the perf tool and the FlameGraph tool. I frequently use flame graphs to gain insight into a program’s performance characteristics, identify potential bottlenecks, and find functions that are worth optimizing.
The methods presented work well with C or Rust code. If you want to profile a Java application, I highly recommend using the async-profiler tool, which is optimized for Java applications and provides similar functionality.